Monitoring, Notifications, and a Dashboard: Completing the Homelab Stack
This is Part 3 of the Wyse 5070 homelab series. Part 1 covered installing Proxmox, setting up AdGuard Home with Unbound, and connecting to Tailscale. Part 2 added Nginx Proxy Manager with wildcard TLS certificates and remote access. If you haven’t done those yet, start there — this guide builds directly on that infrastructure.
At this point the homelab runs, it’s accessible from anywhere, and every service has a clean HTTPS URL. But I have no idea when something breaks. If AdGuard goes down at 2am, I find out when my wife asks why the internet is slow. If Proxmox crashes while I’m at work, I come home to a dead lab and no idea how long it’s been down.
The fix is three lightweight services that turn this from a collection of containers into something that actually watches itself:
Uptime Kuma monitors every service and tracks uptime history. ntfy sends push notifications to my phone when something goes down. Homepage gives me a single dashboard to see everything at a glance instead of remembering six different URLs.
All three run as Docker containers on CT 101 — the same LXC container that already runs Nginx Proxy Manager. They follow the exact same pattern from Part 2: deploy in Docker, add a proxy host in NPM, get instant HTTPS at *.lab.atilho.com. No Cloudflare changes, no AdGuard changes, no new LXC containers needed.
The Architecture
Here’s what the stack looks like after this writeup:
┌──────────────────────────────────────────────────────────────┐
│  Dell Wyse 5070 Extended — Proxmox VE 9.x                    │
│  192.168.4.2 (pve01.lab.atilho.com)                          │
│                                                               │
│  ┌─────────────────────┐  ┌─────────────────────────────────┐ │
│  │ CT 100 — AdGuard    │  │ CT 101 — Docker Services        │ │
│  │ + Unbound           │  │ 192.168.4.4                     │ │
│  │ 192.168.4.3         │  │                                 │ │
│  │ DNS :53             │  │ Nginx Proxy Manager  :80/:443   │ │
│  │ Dashboard :80       │  │ Uptime Kuma          :3001      │ │
│  │ Tailscale ✓         │  │ ntfy                 :8080      │ │
│  └─────────────────────┘  │ Homepage             :3000      │ │
│                            │ Tailscale ✓                     │ │
│                            └─────────────────────────────────┘ │
│                                                               │
│  Tailscale ✓ on host                                          │
└──────────────────────────────────────────────────────────────┘
         │
    ┌────┴────┐
    │  eero   │  Router: 192.168.4.1
    │ Gateway │  DNS → 192.168.4.3 (primary)
    └─────────┘       → 192.168.4.118 (backup Pi-hole)
What’s new: Three Docker containers join NPM on CT 101. Uptime Kuma watches all services and pushes alerts through ntfy when something goes down. Homepage ties it all together into a single landing page. Everything gets HTTPS through the existing wildcard cert — zero additional TLS or DNS configuration.
Why These Three
There are a lot of monitoring and dashboard tools out there. Here’s why I picked these:
Uptime Kuma over Grafana/Prometheus. Grafana + Prometheus is the monitoring gold standard, but it’s overkill for a single-node homelab with five services. That combo wants dedicated resources, a time-series database, and configuration files longer than the services they’re monitoring. Uptime Kuma is a single container with a web UI — add a URL, set an interval, done. When I have multiple nodes and actually need metrics visualization, I’ll add Grafana. Not today.
ntfy over Gotify, Pushover, or email. ntfy is self-hosted (no third-party accounts), uses standard HTTP to publish messages (curl -d "test" ntfy.lab.atilho.com/alerts — that’s it), and has native iOS and Android apps that receive push notifications. Pushover costs $5 per platform. Gotify doesn’t have an iOS app. Email notifications are unreliable and easy to ignore. ntfy hits the sweet spot.
Homepage over Heimdall, Dashy, or Homarr. Homepage is statically generated (fast), configured via YAML files (version-controllable), and has native widget integrations for Uptime Kuma, AdGuard, Proxmox, and basically every self-hosted app. It’s also actively maintained with frequent releases. Dashy is flashier but heavier. Heimdall is simpler but has no widget support. Homepage is the right balance.
Prerequisites
Before starting, you need:
- Everything from Parts 1 and 2 working (Proxmox, AdGuard, NPM with wildcard cert, Docker on CT 101)
- SSH access to CT 101 (
ssh root@192.168.4.4) - About 30–45 minutes
Part 1: Deploy ntfy
We’re starting with ntfy instead of Uptime Kuma because Uptime Kuma needs somewhere to send alerts. If we set up monitoring first, we’d have to circle back and wire up notifications after. This way, ntfy is ready and waiting when we configure Uptime Kuma’s alerting.
1.1 — Create the Compose File
SSH into CT 101:
ssh root@192.168.4.4
Create a directory for ntfy and the compose file:
mkdir -p /opt/ntfy && cd /opt/ntfy
cat <<'EOF' > docker-compose.yml
services:
  ntfy:
    image: binwiederhier/ntfy
    container_name: ntfy
    command:
      - serve
    restart: unless-stopped
    environment:
      - TZ=America/New_York
    ports:
      - "8080:80"
    volumes:
      - ./cache:/var/cache/ntfy
      - ./config:/etc/ntfy
EOF
Why port 8080? ntfy defaults to port 80 inside the container, but NPM already owns port 80 on CT 101. We map it to 8080 on the host — NPM will proxy to this port, so you’ll never actually type :8080 in a browser.
Why no user: directive? Running as root inside the container keeps things simple for a homelab behind a reverse proxy on a private network. If you want to lock it down later, you can add user: "1000:1000" and chown the volume directories accordingly.
1.2 — Configure the Server
Create a minimal server config:
mkdir -p /opt/ntfy/config
cat <<'EOF' > /opt/ntfy/config/server.yml
base-url: https://ntfy.lab.atilho.com
upstream-base-url: https://ntfy.sh
cache-file: /var/cache/ntfy/cache.db
cache-duration: "12h"
behind-proxy: true
EOF
A few things worth explaining here:
base-url tells ntfy its own public URL. This is used for generating links in notifications and for the web UI.
upstream-base-url is the key line for iOS push notifications. Apple requires notifications to be routed through Apple’s Push Notification service (APNs), and ntfy.sh acts as the relay. Without this line, the iOS app won’t receive push notifications — you’d only see them when you manually open the app. Android doesn’t need this (it uses Firebase or UnifiedPush), but it doesn’t hurt to have it set.
cache-file and cache-duration persist messages for 12 hours. If your phone is offline when an alert fires, you’ll still get it when you reconnect — as long as it’s within 12 hours.
behind-proxy tells ntfy to trust the X-Forwarded-For header from NPM for accurate client IPs in logs.
1.3 — Start It Up
cd /opt/ntfy
docker compose up -d
First pull takes about 30 seconds — ntfy is a small image. Once it’s done:
docker compose ps
You should see ntfy running with port 8080->80 mapped.
1.4 — Quick Test
Send yourself a test notification from the command line:
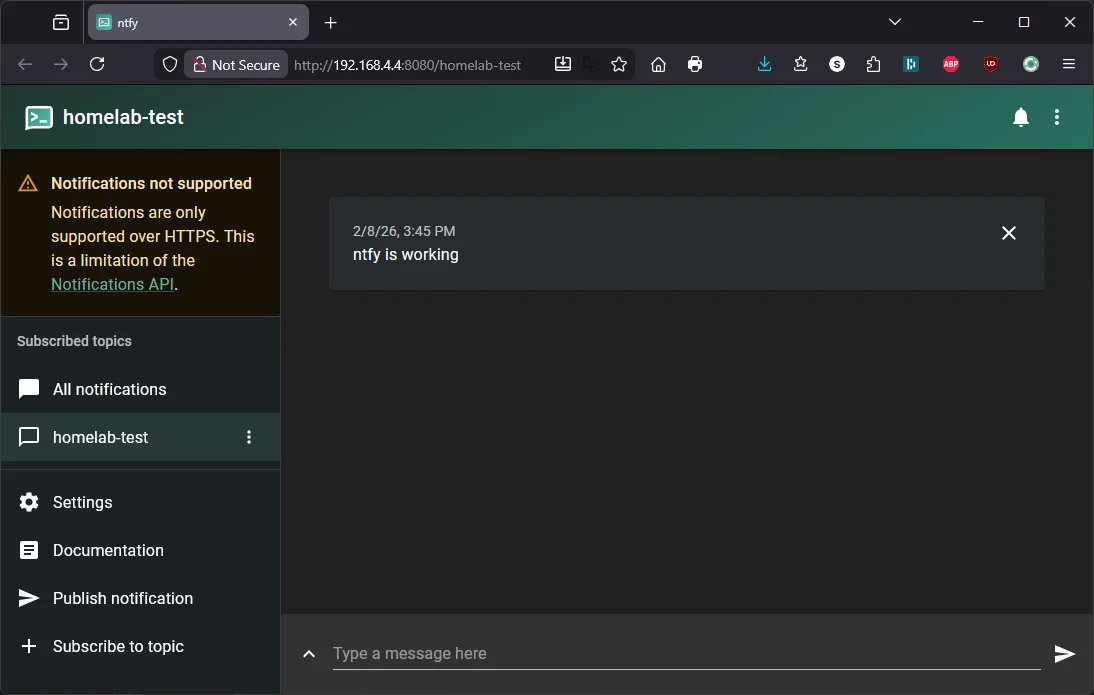
curl -d "ntfy is working" http://localhost:8080/homelab-test
Then open http://192.168.4.4:8080/homelab-test in a browser. You should see the ntfy web UI with your test message displayed.
1.5 — Add NPM Proxy Host
Open NPM at https://npm.lab.atilho.com (or http://192.168.4.4:81):
- Go to Hosts → Proxy Hosts
- Click Add Proxy Host
- Details tab:
| Field | Value |
|---|---|
| Domain Names | ntfy.lab.atilho.com |
| Scheme | http |
| Forward Hostname / IP | 192.168.4.4 |
| Forward Port | 8080 |
| Block Common Exploits | ✅ |
| Websockets Support | ✅ |
- SSL tab:
| Field | Value |
|---|---|
| SSL Certificate | Select the *.lab.atilho.com cert |
| Force SSL | ✅ |
| HTTP/2 Support | ✅ |
- Click Save
Test it: Open https://ntfy.lab.atilho.com in your browser. You should see the ntfy web UI with a padlock — same test message from earlier should still be there.
1.6 — Set Up Push Notifications on Your Phone
Android
The Android app works reliably. Install ntfy from Google Play, change the default server to https://ntfy.lab.atilho.com in Settings, subscribe to homelab-alerts, and you’re done.
iOS — Use the Web App (PWA), Not the Native App
The ntfy iOS app has well-documented issues with push notifications on self-hosted servers. Notifications silently fail to arrive, or only show up as “New message” without content. The root cause involves Firebase/APNs relay bugs and a Notification Service Extension issue that the developer hasn’t been able to resolve. Multiple GitHub issues are open on this — it’s not a config problem on your end.
The workaround that actually works: save ntfy as a web app.
Since we set up ntfy behind NPM with a valid HTTPS cert, the web UI supports browser push notifications natively — no native app needed.
- Open Safari on your iPhone (this must be Safari — Chrome on iOS doesn’t support Add to Home Screen with push notifications)
- Navigate to
https://ntfy.lab.atilho.com - Tap the Share button (square with arrow) → Add to Home Screen
- Name it
ntfy→ tap Add - Open the web app from your home screen
- Click Subscribe to topic → enter
homelab-alerts - When the browser asks “ntfy.lab.atilho.com” Would Like to Send You Notifications → tap Allow
That’s it. The PWA receives push notifications through the browser’s notification system instead of going through Apple’s APNs relay, which sidesteps the iOS app’s issues entirely.
Test push notifications:
curl -d "Phone test from CT 101" https://ntfy.lab.atilho.com/homelab-alerts
Your phone should buzz within a few seconds. If it doesn’t, check that notifications are enabled in iOS Settings → Notifications → ntfy.lab.atilho.com (it shows up as a website, not an app).
Why this works: The
upstream-base-urland APNs relay are only needed for the native iOS app’s background delivery. The PWA uses standard Web Push (via the browser), which doesn’t touch Firebase or APNs at all. As long as your ntfy server has a valid HTTPS cert — which it does, thanks to NPM — Web Push just works.
Still having issues on iOS? The PWA can also be unreliable when the device is locked for extended periods — iOS aggressively suspends background web app activity. If you need rock-solid iOS notifications, set up Telegram as your notification channel in Uptime Kuma instead. It’s free and Telegram’s iOS push delivery is bulletproof. See Part 2.6 for the setup steps.
Part 2: Deploy Uptime Kuma
Now that ntfy is running and your phone is subscribed, we can set up monitoring that actually tells you when something breaks.
2.1 — Create the Compose File
mkdir -p /opt/uptime-kuma && cd /opt/uptime-kuma
cat <<'EOF' > docker-compose.yml
services:
  uptime-kuma:
    image: louislam/uptime-kuma:2
    container_name: uptime-kuma
    restart: unless-stopped
    ports:
      - "3001:3001"
    volumes:
      - ./data:/app/data
EOF
That’s it. Uptime Kuma v2 is a single container — you choose the database engine during first-run setup (we’ll pick SQLite). No external databases, no sidecars, no config files. Everything is configured through the web UI.
Why the :2 tag instead of :latest? Uptime Kuma v2 was a major release with breaking changes from v1 (new database schema, removed JSON backup/restore, dropped legacy browser support). Pinning to :2 means you get v2.x patch updates automatically but won’t accidentally jump to v3 if that ever happens.
2.2 — Start It Up
cd /opt/uptime-kuma
docker compose up -d
This pull is larger than ntfy — Uptime Kuma includes Node.js and a full web app. Give it a minute or two.
docker compose ps
You should see uptime-kuma running on port 3001.
2.3 — Initial Setup
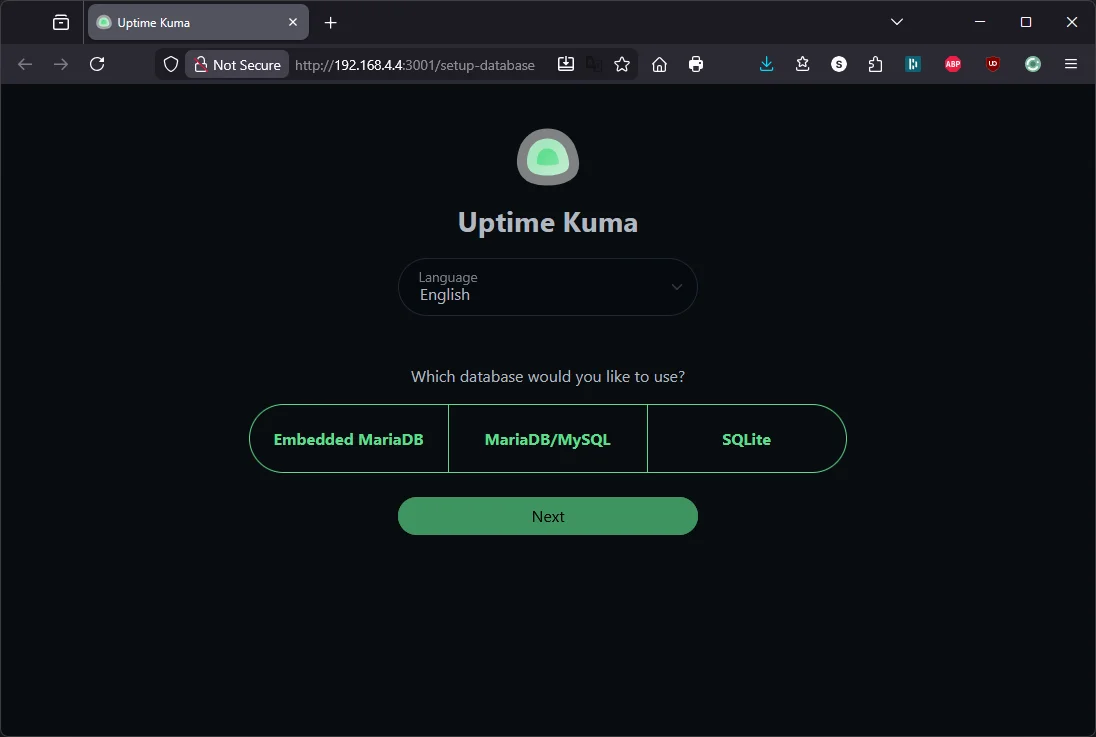
Open http://192.168.4.4:3001 in a browser. You’ll see a setup wizard.
Step 1 — Choose a database: Uptime Kuma v2 gives you three options: Embedded MariaDB, MariaDB/MySQL, and SQLite. Pick SQLite. It’s the lightest option — a single file on disk, no external database to manage. The MariaDB options are for large deployments with hundreds of monitors. On a Wyse 5070 watching five services, SQLite is more than enough.
Click Next.
Step 2 — Create your admin account: Set a username and strong password, then click Create.
You’re now in the Uptime Kuma dashboard — empty, waiting for monitors.
2.4 — Add NPM Proxy Host
Same dance as before. In NPM:
- Add Proxy Host
- Details tab:
| Field | Value |
|---|---|
| Domain Names | status.lab.atilho.com |
| Scheme | http |
| Forward Hostname / IP | 192.168.4.4 |
| Forward Port | 3001 |
| Block Common Exploits | ✅ |
| Websockets Support | ✅ |
Websockets Support is important here — Uptime Kuma’s real-time dashboard uses WebSockets heavily. Without it, the UI will feel laggy or broken.
- SSL tab:
| Field | Value |
|---|---|
| SSL Certificate | Select the *.lab.atilho.com cert |
| Force SSL | ✅ |
| HTTP/2 Support | ✅ |
- Click Save
Test it: Open https://status.lab.atilho.com. Uptime Kuma dashboard, valid cert, no warnings.
2.5 — Connect ntfy as a Notification Channel
Before adding monitors, wire up the notification target so every monitor can use it.
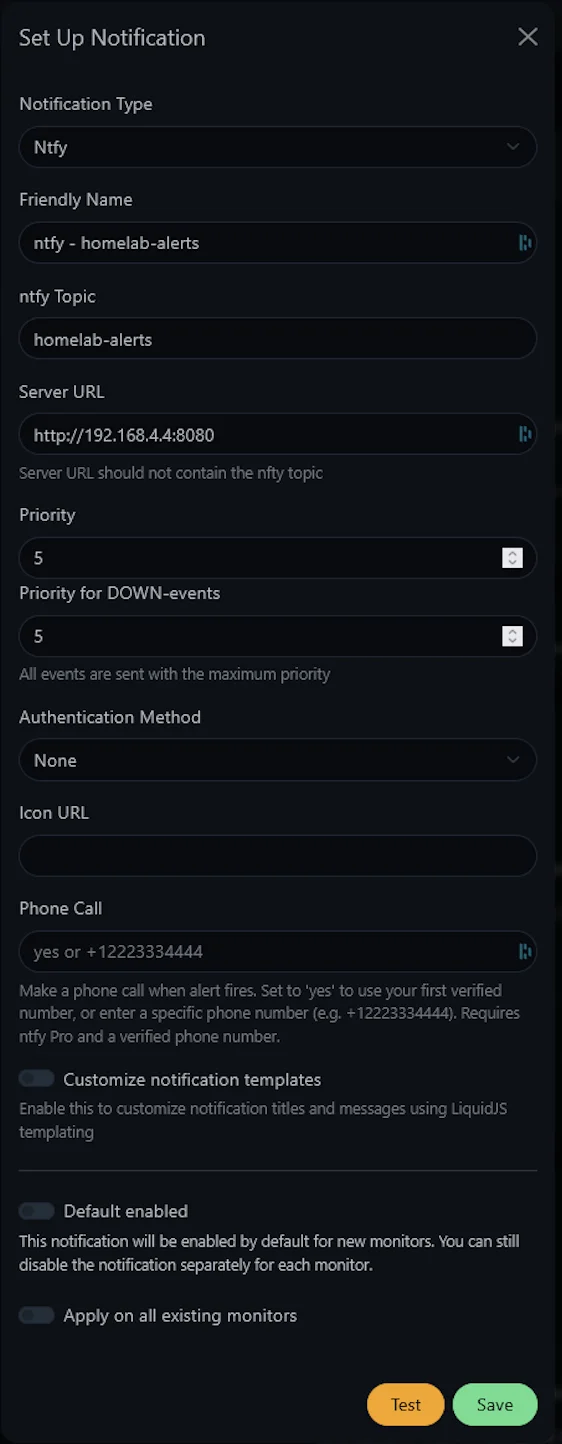
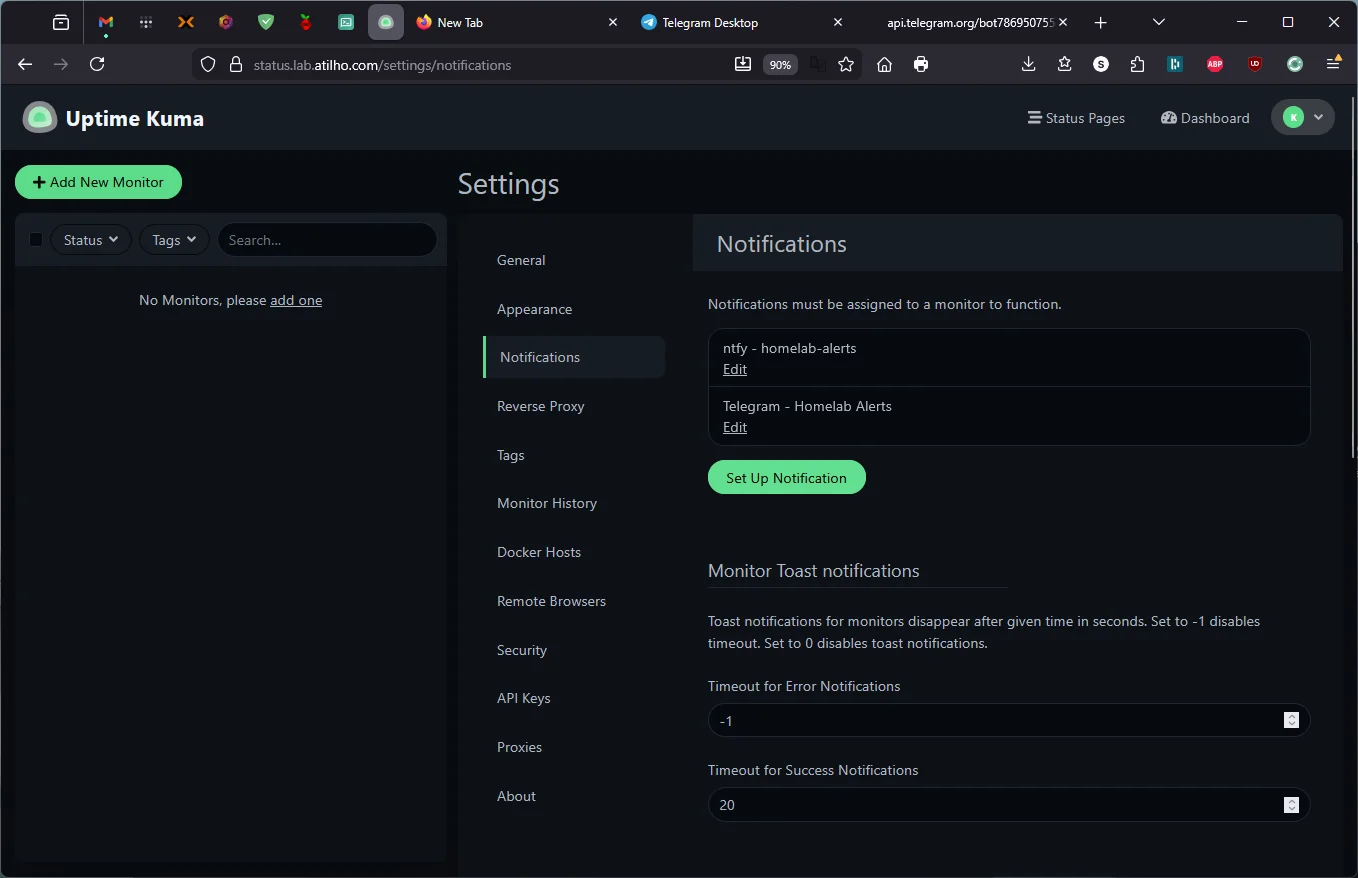
- In Uptime Kuma, click Settings (gear icon, top right) → Notifications
- Click Setup Notification
- Fill in:
| Field | Value |
|---|---|
| Notification Type | ntfy |
| Friendly Name | ntfy - homelab-alerts |
| Server URL | http://192.168.4.4:8080 |
| Topic | homelab-alerts |
Why the internal IP instead of https://ntfy.lab.atilho.com? Both work, but using the LAN IP keeps the traffic inside CT 101’s Docker network and avoids an unnecessary round trip through DNS → NPM → back to the same container. Less latency, fewer moving parts in the notification path.
- Click Test — your phone should buzz with a test notification from Uptime Kuma
- Check Apply on all existing monitors (this won’t do anything yet since there are no monitors, but it’ll auto-apply to any you add while this dialog is open)
- Click Save
2.6 — Alternative: Telegram Notifications (Recommended for iOS)
If you’re on iOS and ntfy push notifications aren’t reliable — whether through the native app or the PWA — Telegram is the best fallback. It’s free, the iOS app has rock-solid push delivery, and Uptime Kuma supports it natively. This takes about 5 minutes.
Create a Telegram Bot
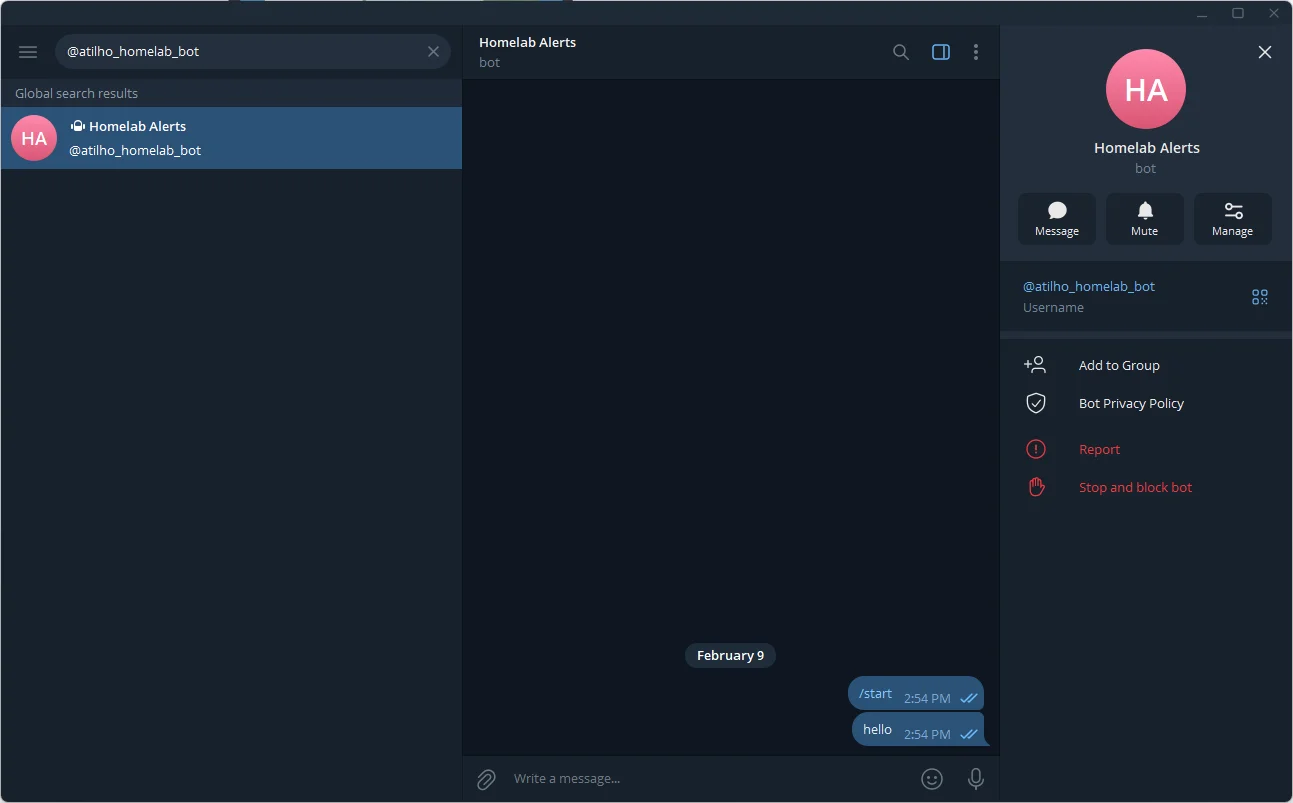
- Open Telegram on your phone and search for @BotFather (the official bot for creating bots)
- Start a chat and send
/newbot - BotFather will ask for a display name — enter something like
Homelab Alerts - Then it asks for a username — this must end in
bot, e.g.,atilho_homelab_bot - BotFather responds with your API token — it looks like
7123456789:AAH2kL9x.... Copy this and save it somewhere safe.
Get Your Chat ID
The bot needs to know where to send messages. You need your personal chat ID:
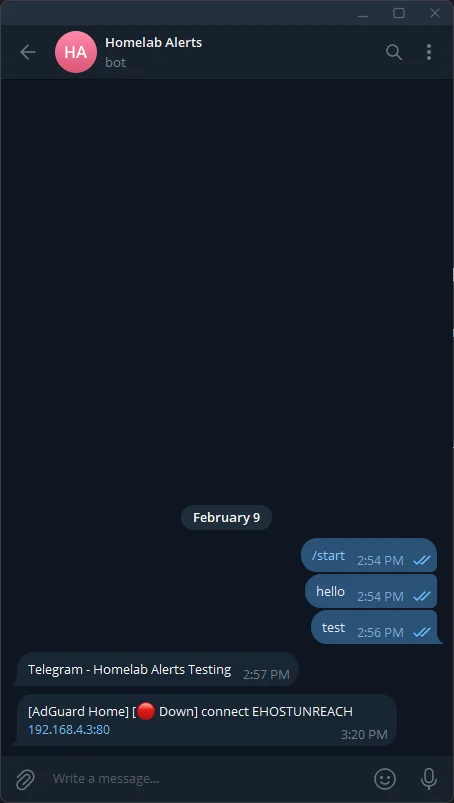
- Search for your new bot in Telegram and tap Start (this opens a conversation with it)
- Send any message to the bot (e.g., “hello”)
- Open this URL in a browser — replace
YOUR_BOT_TOKENwith the token from BotFather:
https://api.telegram.org/botYOUR_BOT_TOKEN/getUpdates
- In the JSON response, find
"chat":{"id":123456789}— that number is your Chat ID
Tip: If the JSON response is empty (
"result":[]), you haven’t sent a message to the bot yet. Go back to Telegram, send it a message, then refresh the URL.
Add Telegram to Uptime Kuma
- In Uptime Kuma, go to Settings → Notifications → Setup Notification
- Fill in:
| Field | Value |
|---|---|
| Notification Type | Telegram |
| Friendly Name | Telegram - Homelab Alerts |
| Bot Token | Your bot token from BotFather |
| Chat ID | Your chat ID from the step above |
- Click Test — you should get a message from your bot in Telegram instantly
- Toggle Default enabled to ON so all new monitors use this automatically
- Click Save
Now you have two notification channels: ntfy (which works great on Android and desktop) and Telegram (which is bulletproof on iOS). Uptime Kuma will fire both when a service goes down — belt and suspenders.
2.7 — Add Monitors
Now add monitors for every service in the lab. Click Add New Monitor for each:
Proxmox Host
| Field | Value |
|---|---|
| Monitor Type | HTTP(s) |
| Friendly Name | Proxmox |
| URL | https://192.168.4.2:8006 |
| Heartbeat Interval | 60 seconds |
| Retries | 2 |
| Accepted Status Codes | 200-299 |
Under Advanced → toggle Ignore TLS/SSL errors to ON. Proxmox uses a self-signed cert internally.
Under Notifications → make sure your preferred notification channel is checked — ntfy - homelab-alerts, Telegram - Homelab Alerts, or both if you set up both.
Why 2 retries? With retries at 0, a single failed health check — a network hiccup, a brief CPU spike — triggers an alert immediately. Setting it to 2 means Uptime Kuma needs 3 consecutive failures (3 minutes at a 60-second interval) before marking the service as down and notifying you. This avoids false alarms at 2am while still catching real outages quickly.
AdGuard Home
| Field | Value |
|---|---|
| Monitor Type | HTTP(s) |
| Friendly Name | AdGuard Home |
| URL | http://192.168.4.3:80 |
| Heartbeat Interval | 60 seconds |
| Retries | 2 |
| Accepted Status Codes | 200-299 (default) |
Under Notifications → confirm your notification channel is checked.
Nginx Proxy Manager
| Field | Value |
|---|---|
| Monitor Type | HTTP(s) |
| Friendly Name | Nginx Proxy Manager |
| URL | http://192.168.4.4:81 |
| Heartbeat Interval | 60 seconds |
| Retries | 2 |
| Accepted Status Codes | 200-299 (default) |
Under Notifications → confirm your notification channel is checked.
Pi-hole (Backup DNS)
| Field | Value |
|---|---|
| Monitor Type | HTTP(s) |
| Friendly Name | Pi-hole |
| URL | http://192.168.4.118/admin |
| Heartbeat Interval | 120 seconds |
| Retries | 2 |
| Accepted Status Codes | 200-299 (default) |
The Pi is backup infrastructure, so a 2-minute interval is fine — no need to poll it as aggressively. Note the /admin path — Pi-hole returns a 403 on the root URL and redirects to the dashboard at /admin.
Under Notifications → confirm your notification channel is checked.
ntfy
| Field | Value |
|---|---|
| Monitor Type | HTTP(s) |
| Friendly Name | ntfy |
| URL | http://192.168.4.4:8080/v1/health |
| Heartbeat Interval | 60 seconds |
| Retries | 2 |
| Accepted Status Codes | 200-299 (default) |
ntfy exposes a /v1/health endpoint that returns {"healthy":true} — use that instead of the root URL.
Under Notifications → confirm your notification channel is checked.
Note on notifications and defaults: If you toggled “Default enabled” when creating your notification channel in Part 2.5 or 2.6, every new monitor automatically inherits that channel — you’ll see it pre-checked. If you didn’t, you’ll need to manually enable it on each monitor. Either way, always verify the checkbox before saving.
Note on TLS/SSL: Only the Proxmox monitor needs “Ignore TLS/SSL errors” enabled — because Proxmox uses HTTPS with a self-signed certificate. The other monitors all connect over plain HTTP internally, so there’s no TLS handshake to fail. Leave it unchecked for AdGuard, NPM, Pi-hole, and ntfy.
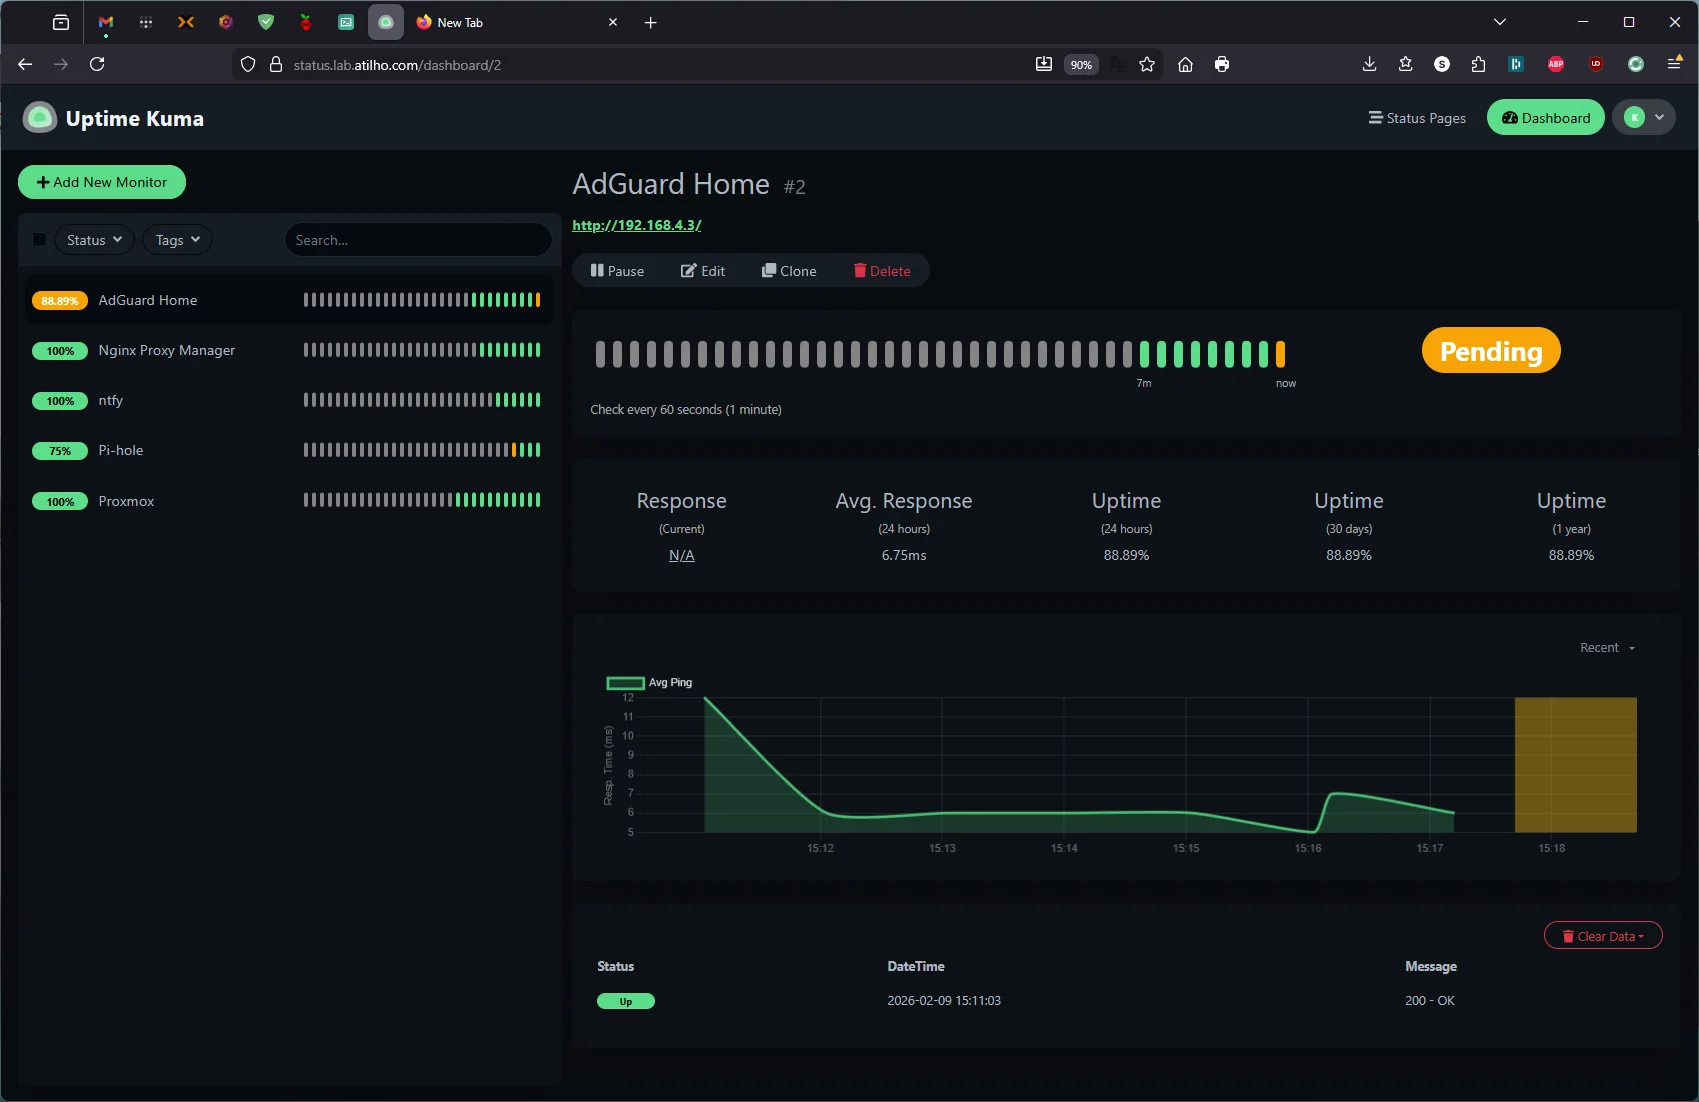
After a few minutes, you should see green bars across the board. If anything is red, check that the URL and port are correct, and that the service is actually running.
2.8 — Test the Full Alert Chain
Let’s make sure the entire pipeline works: Uptime Kuma detects outage → publishes to ntfy → phone gets push notification.
SSH into the Proxmox host and temporarily stop the AdGuard container:
ssh root@192.168.4.2
pct stop 100
Within 60 seconds, Uptime Kuma should detect AdGuard is down, turn the monitor red, and fire notifications through your configured channels — ntfy, Telegram, or both. Your phone should buzz.
Heads up: If you’re accessing Uptime Kuma through its hostname (
status.lab.atilho.com), the web UI may show a “Cannot connect to the socket server” error and go unresponsive. This is because you just killed your primary DNS server — your browser can’t resolve the hostname anymore. Don’t panic. Uptime Kuma is still running and still sending alerts in the background (the monitors use IP addresses, not hostnames). You can verify by accessing Uptime Kuma directly athttp://192.168.4.4:3001while DNS is down, or just check your phone for the Telegram/ntfy notification. Start AdGuard back up withpct start 100and the WebSocket will reconnect automatically.
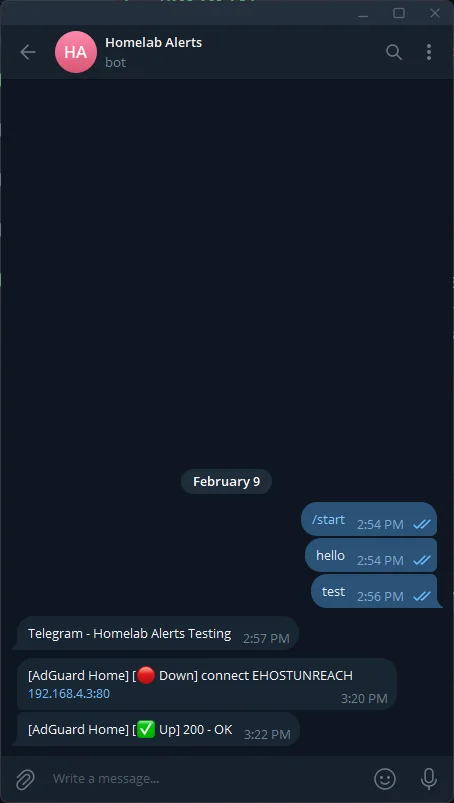
Bring it back:
pct start 100
You should get a second notification when the service comes back up (“AdGuard Home is back online” or similar).
Heads up: While AdGuard is down, DNS stops working for your network (the Pi-hole backup should pick up most of it, but there may be a brief hiccup). Do this test when you’re not in the middle of something — and keep it under a minute.
Part 3: Deploy Homepage
The last piece: a single landing page so you stop typing URLs from memory.
3.1 — Create the Compose File
mkdir -p /opt/homepage/config && cd /opt/homepage
cat <<'EOF' > docker-compose.yml
services:
  homepage:
    image: ghcr.io/gethomepage/homepage:latest
    container_name: homepage
    restart: unless-stopped
    environment:
      HOMEPAGE_ALLOWED_HOSTS: dash.lab.atilho.com
      HOMEPAGE_ALLOW_INSECURE: "true"
      HOMEPAGE_VAR_PROXMOX_URL: https://192.168.4.2:8006
      HOMEPAGE_VAR_PROXMOX_USER: homepage@pam!homepage
      HOMEPAGE_VAR_PROXMOX_PASS: YOUR_PROXMOX_API_TOKEN_SECRET
      HOMEPAGE_VAR_ADGUARD_URL: http://192.168.4.3
      HOMEPAGE_VAR_ADGUARD_USER: YOUR_ADGUARD_USERNAME
      HOMEPAGE_VAR_ADGUARD_PASS: YOUR_ADGUARD_PASSWORD
      HOMEPAGE_VAR_NPM_URL: http://192.168.4.4:81
      HOMEPAGE_VAR_NPM_USER: YOUR_NPM_EMAIL
      HOMEPAGE_VAR_NPM_PASS: YOUR_NPM_PASSWORD
      HOMEPAGE_VAR_PIHOLE_URL: https://192.168.4.118
      HOMEPAGE_VAR_PIHOLE_KEY: "YOUR_PIHOLE_APP_PASSWORD"
      HOMEPAGE_VAR_UPTIME_KUMA_URL: http://192.168.4.4:3001
    ports:
      - "3000:3000"
    volumes:
      - ./config:/app/config
      - /var/run/docker.sock:/var/run/docker.sock:ro
EOF
Replace the YOUR_* placeholders with your actual credentials:
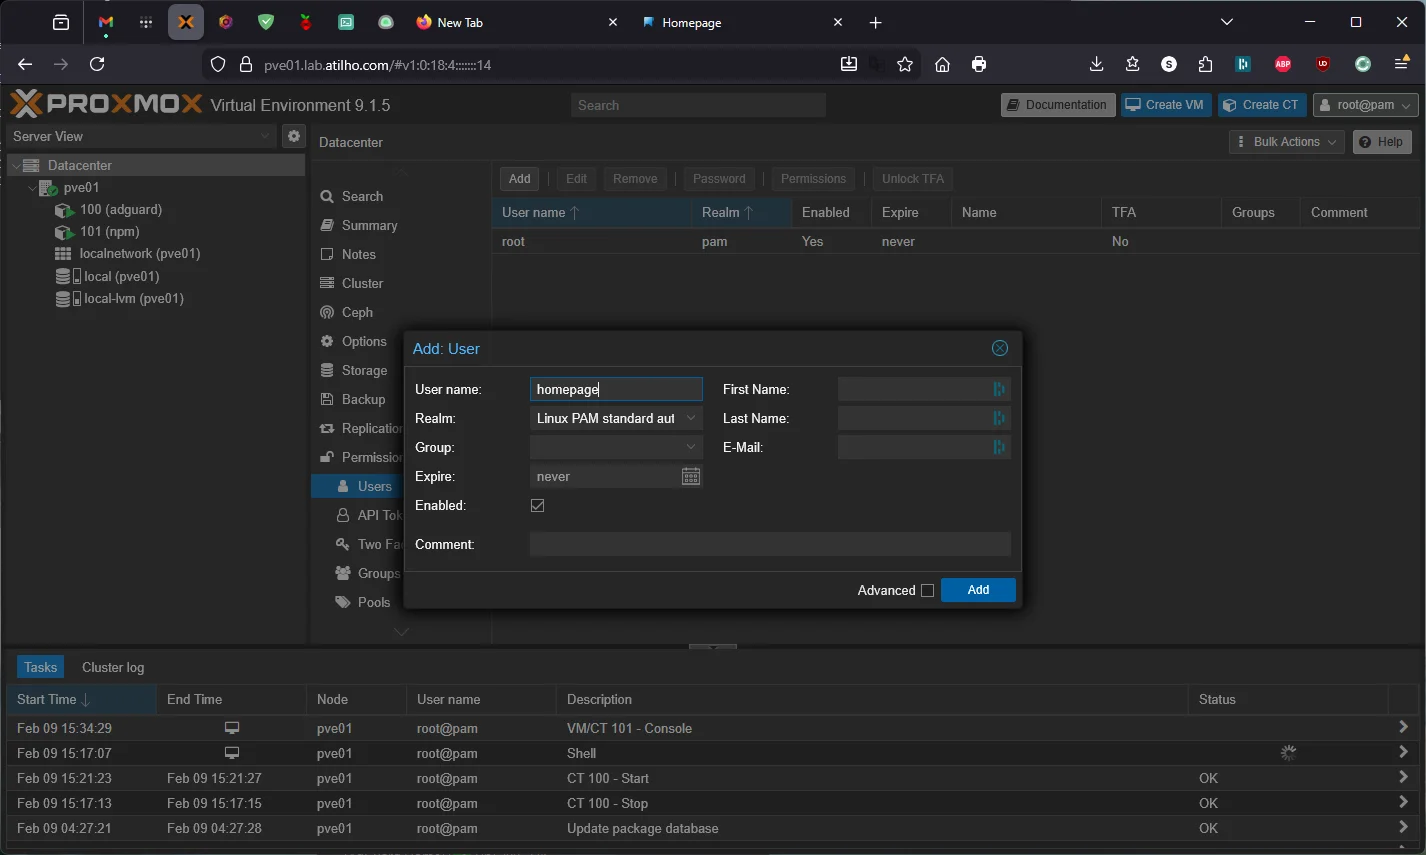
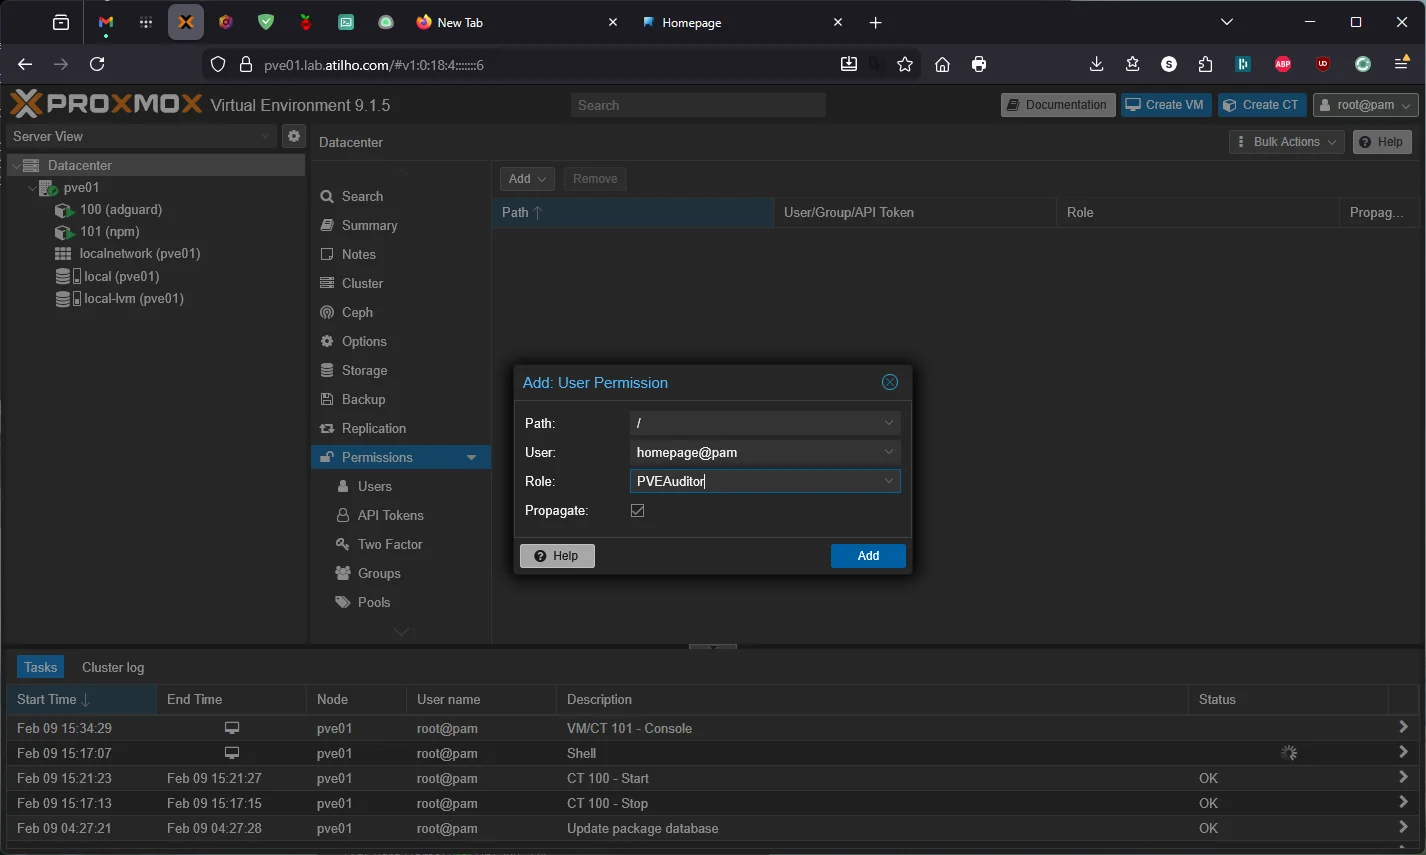
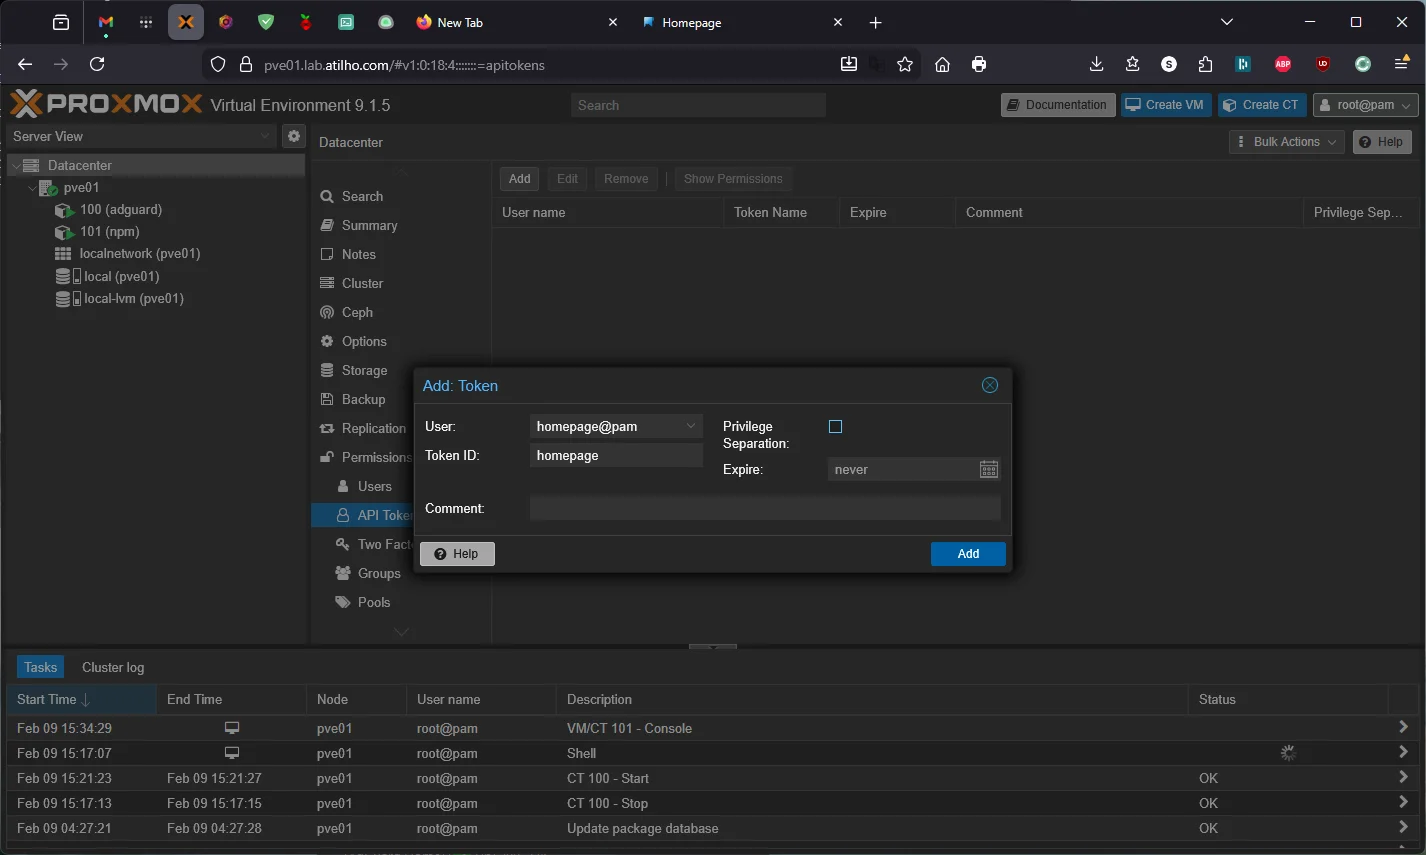
YOUR_PROXMOX_API_TOKEN_SECRET— you’ll need to create an API token in Proxmox. Go to Datacenter → Permissions → Users → Add → create a userhomepage(Realm:Linux PAM standard authentication). Then go to Permissions → Add → User Permission → Path/, Userhomepage@pam, RolePVEAuditor, check Propagate. Finally, go to API Tokens → Add → Userhomepage@pam, Token IDhomepage, uncheck Privilege Separation → copy the secret immediately — it’s only shown once. ThePVEAuditorrole gives read-only access, which is all Homepage needs.
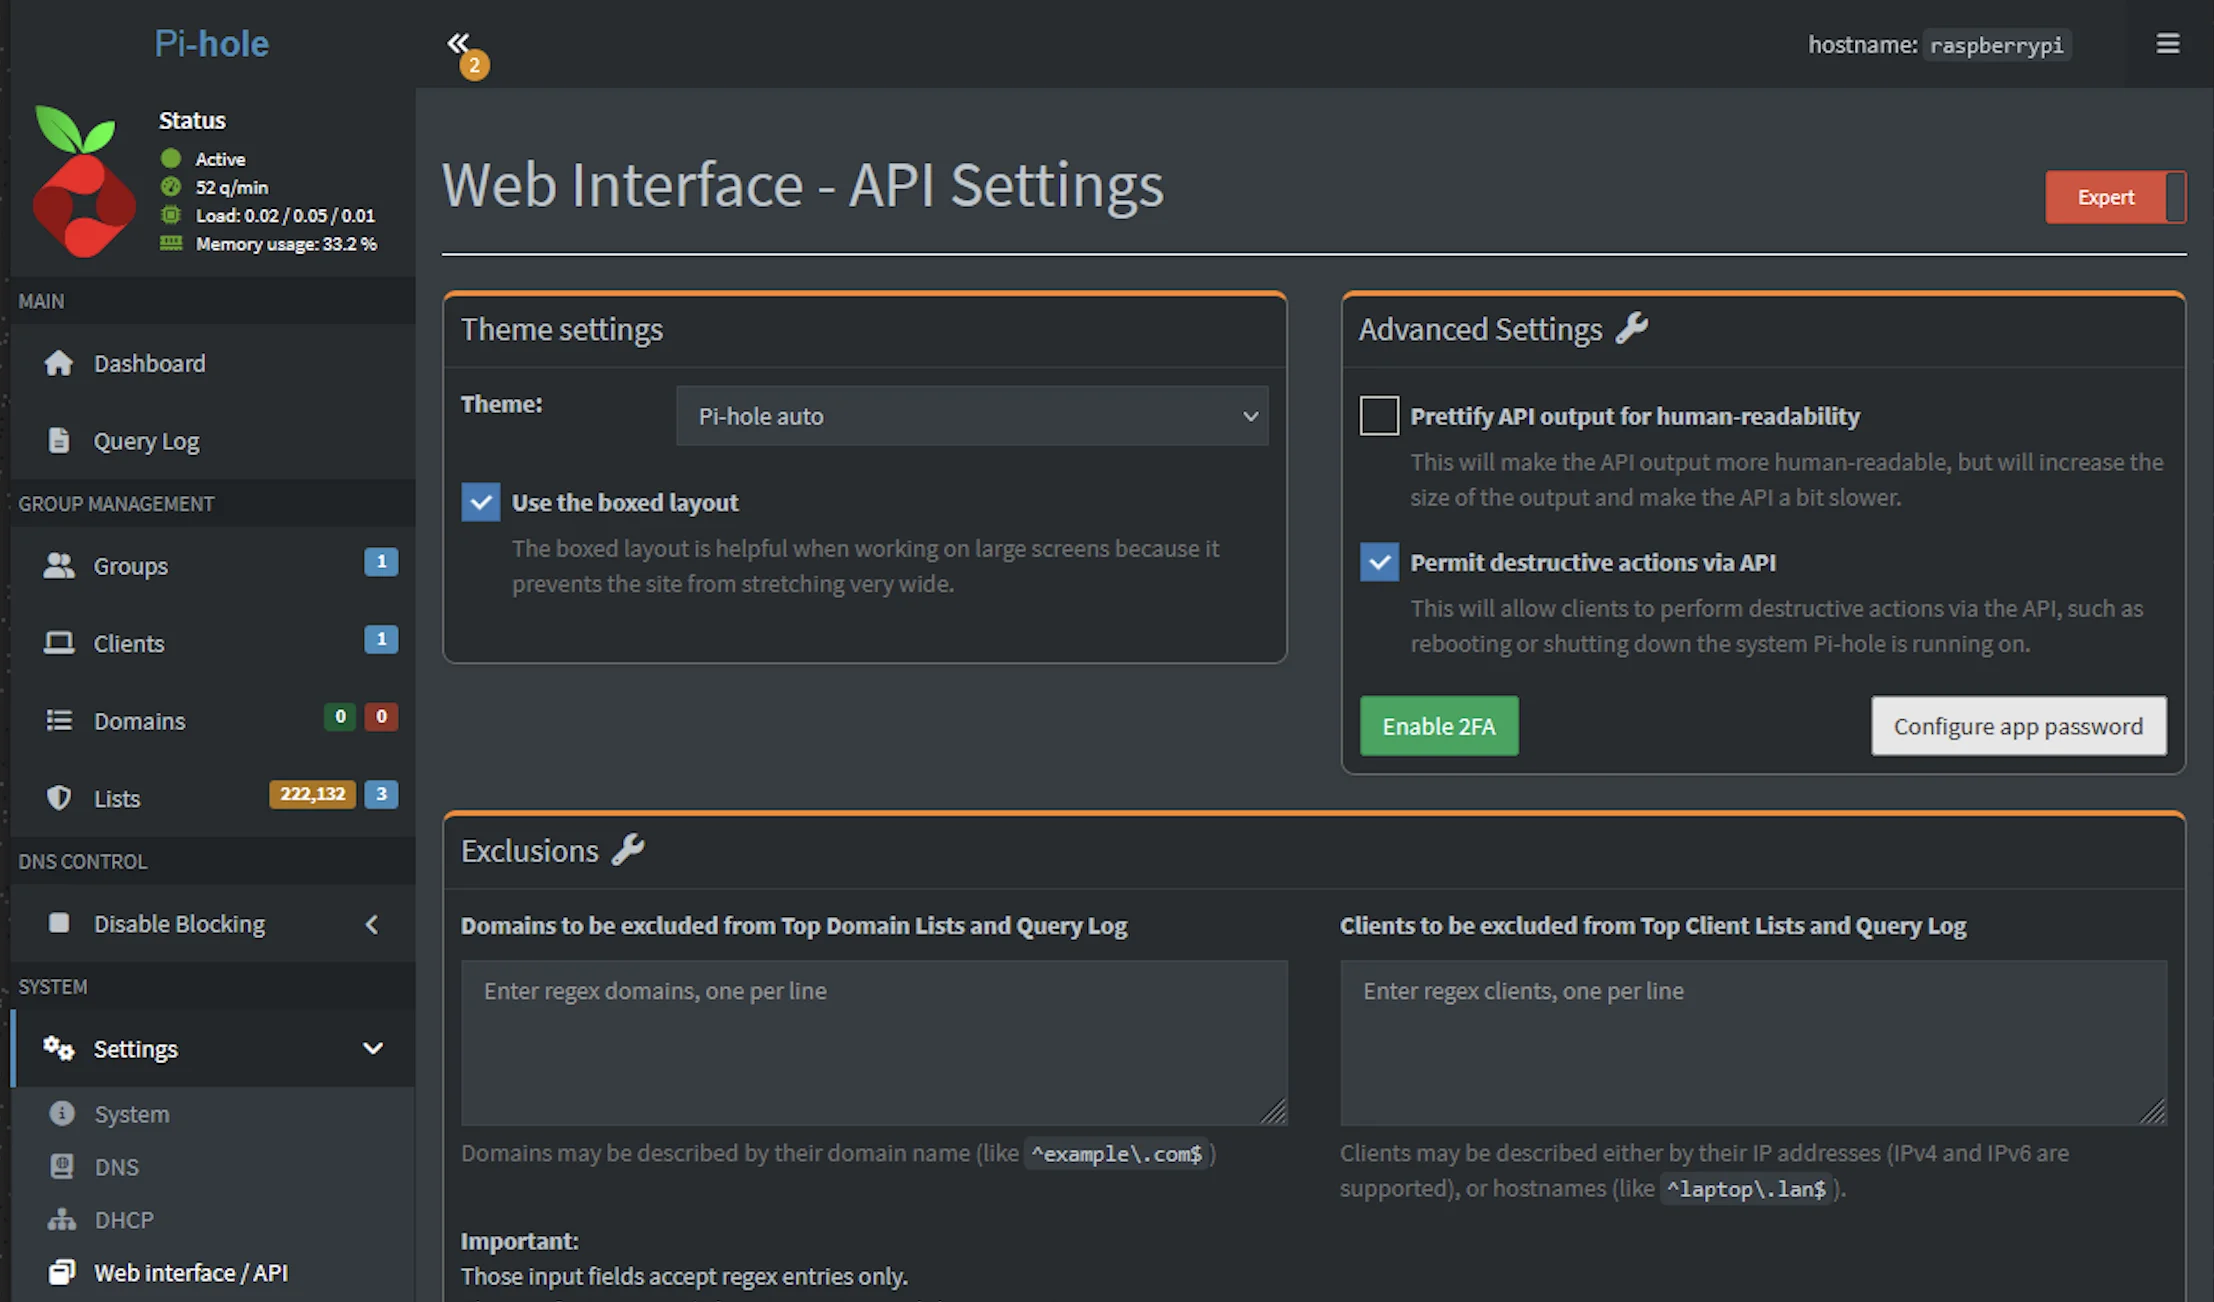
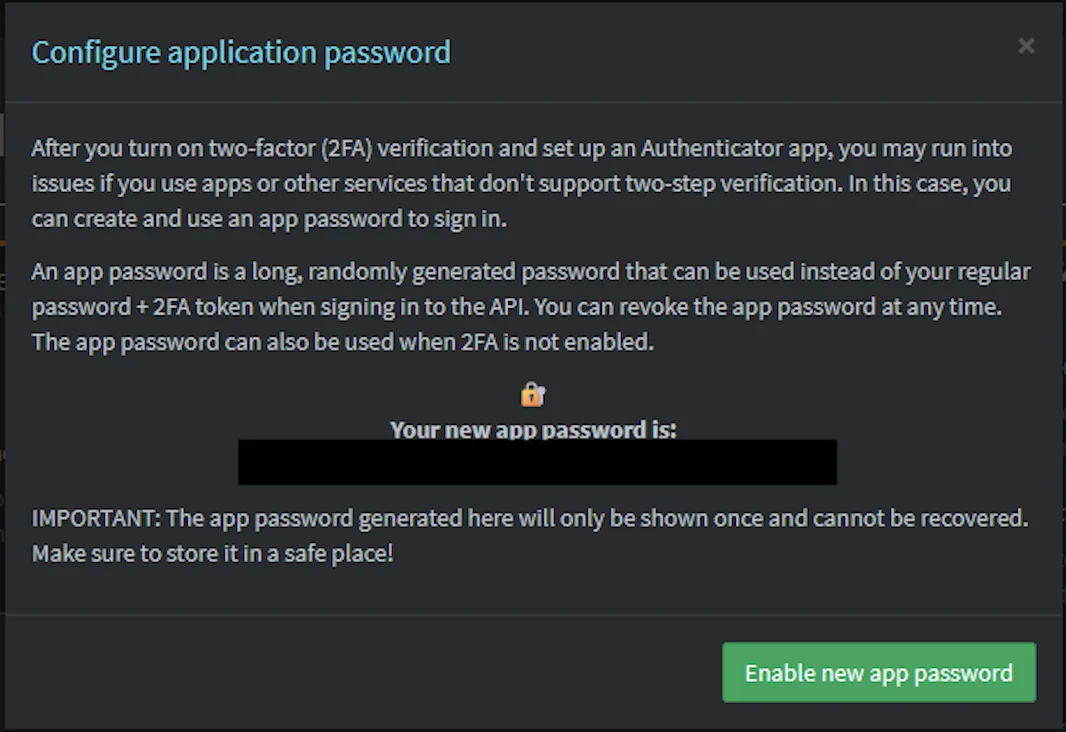
YOUR_ADGUARD_USERNAME/YOUR_ADGUARD_PASSWORD— AdGuard Home dashboard loginYOUR_NPM_EMAIL/YOUR_NPM_PASSWORD— Nginx Proxy Manager admin loginYOUR_PIHOLE_APP_PASSWORD— go to Pi-hole admin → Settings → Web interface / API → click Configure app password → click Enable new app password. Copy the generated password immediately — it’s only shown once and can’t be recovered. This is a dedicated credential separate from your main Pi-hole login, so you can revoke it anytime without changing your admin password.
Pi-hole v6 requires HTTPS. Pi-hole v6 runs its web server and API over HTTPS by default with a self-signed certificate. That’s why the URL is
https://192.168.4.118and nothttp://. TheHOMEPAGE_ALLOW_INSECUREenvironment variable tells Homepage to accept self-signed certificates when talking to backend services — without it, the Pi-hole widget will fail with an authentication error because Homepage rejects the TLS handshake before even sending the password.
Watch for
$in passwords: Docker Compose treats$as a variable reference. If any of your passwords contain a$, double it to$$in docker-compose.yml. For example, if your Pi-hole app password isabc$Ahq657Dxyz, enter it asabc$$Ahq657Dxyz. Otherwise you’ll see warnings likeThe "Ahq657D" variable is not setand the password will be silently mangled.
Quote passwords with special characters: Pi-hole app passwords often contain
/,+, and=characters. Wrap the value in double quotes in docker-compose.yml to prevent YAML from misinterpreting them:HOMEPAGE_VAR_PIHOLE_KEY: "p/ts3oDB+xUvUT=". Without quotes,=in particular can break YAML parsing, and the env var will silently end up empty inside the container.
Why environment variables? Instead of hardcoding credentials directly in the YAML config files, Homepage supports `` substitution — you define the values once in docker-compose, and reference them in the config with double curly braces. This keeps sensitive data in one place. If a password changes, you update it in docker-compose and docker compose up -d — no hunting through config files. It also means you can share your config files without accidentally leaking credentials.
HOMEPAGE_ALLOWED_HOSTS is required. Since v1.0, Homepage rejects requests from hostnames not in this list as a security measure against DNS rebinding attacks. If you skip this, you’ll get a blank page or an error when accessing it through the reverse proxy. The value must match the hostname you’ll use — dash.lab.atilho.com in our case. localhost:3000 is always allowed by default.
Docker socket mount is optional but useful. It lets Homepage display container status (running/stopped) and basic stats (CPU, memory) for all Docker containers on CT 101. It’s mounted read-only (:ro) — Homepage can’t start, stop, or modify containers.
3.2 — Configure Homepage
Homepage is configured entirely through YAML files in the config directory. Let’s set up the four key files.
settings.yaml
cat <<'EOF' > /opt/homepage/config/settings.yaml
title: Homelab
favicon: https://cdn.jsdelivr.net/gh/walkxcode/dashboard-icons/png/heimdall.png
theme: dark
color: slate
headerStyle: clean
layout:
  Infrastructure:
    style: row
    columns: 4
  Monitoring:
    style: row
    columns: 3
  Network:
    style: row
    columns: 2
EOF
services.yaml
This is the main file — it defines what shows up on the dashboard:
cat <<'EOF' > /opt/homepage/config/services.yaml
- Infrastructure:
    - Proxmox:
        icon: proxmox
        href: https://pve01.lab.atilho.com
        description: Hypervisor
        widget:
          type: proxmox
          url:
          username:
          password:
          node: pve01
    - AdGuard Home:
        icon: adguard-home
        href: https://adguard.lab.atilho.com
        description: DNS + Ad Blocking
        widget:
          type: adguard
          url:
          username:
          password:
    - Nginx Proxy Manager:
        icon: nginx-proxy-manager
        href: https://npm.lab.atilho.com
        description: Reverse Proxy + TLS
        widget:
          type: npm
          url:
          username:
          password:
    - Pi-hole:
        icon: pi-hole
        href: https://pihole.lab.atilho.com/admin
        description: Backup DNS
        widget:
          type: pihole
          url:
          version: 6
          key:

- Monitoring:
    - Uptime Kuma:
        icon: uptime-kuma
        href: https://status.lab.atilho.com
        description: Service Monitoring
        widget:
          type: uptimekuma
          url:
          slug: default
    - ntfy:
        icon: ntfy
        href: https://ntfy.lab.atilho.com
        description: Push Notifications
    - Homepage:
        icon: homepage
        href: https://dash.lab.atilho.com
        description: This dashboard

- Network:
    - Tailscale:
        icon: tailscale
        href: https://login.tailscale.com/admin/machines
        description: Mesh VPN
    - Cloudflare:
        icon: cloudflare
        href: https://dash.cloudflare.com
        description: DNS Management
EOF
Notice the `` references — Homepage replaces these at runtime with the environment variables we defined in docker-compose. No credentials touch the config files.
Proxmox widget note: The Proxmox widget requires an API token — it can’t use a regular username/password login. The
usernameformat isuser@realm!tokenid(e.g.,homepage@pam!homepage) and thepasswordis the token secret. We use thePVEAuditorrole which gives Homepage read-only access — it can see resource usage but can’t modify anything.
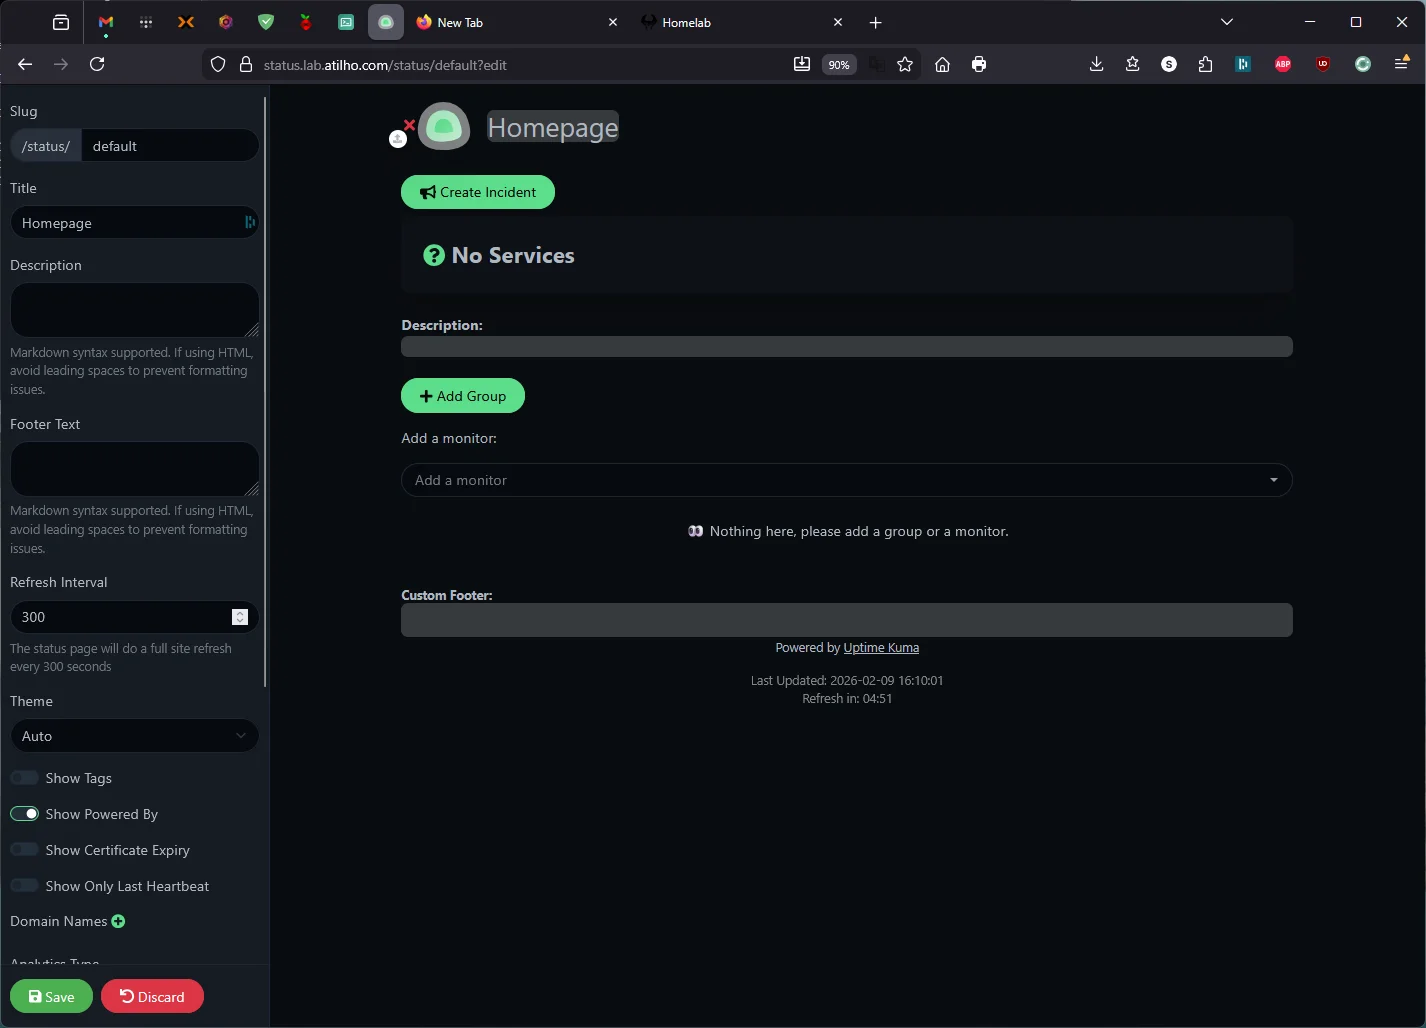
Uptime Kuma widget note: The widget pulls data from a status page, not the dashboard. You need to create one first: in Uptime Kuma, go to Status Pages → New Status Page → set the name to anything you like and the slug to
default. Then add your monitors to the status page and save. Theslug: defaultin the config above must match the slug you created.
Pi-hole v6 note: The
version: 6field is required if you’re running Pi-hole v6 or higher — Homepage defaults to v5’s API format without it. Thekeyfield accepts your app password (generated in Pi-hole → Settings → Web interface / API → Configure app password). Note that the env var name must match between docker-compose and services.yaml — we useHOMEPAGE_VAR_PIHOLE_KEY(notPIHOLE_PASS) because Homepage’s Pi-hole v6 widget expects a field calledkey, and matching the name avoids confusion. Also, Pi-hole v6 serves its API over HTTPS by default, so the URL must behttps://— andHOMEPAGE_ALLOW_INSECURE: "true"is needed in docker-compose to accept the self-signed certificate.
widgets.yaml
These show at the top of the page:
cat <<'EOF' > /opt/homepage/config/widgets.yaml
- search:
    provider: google
    target: _blank
- datetime:
    text_size: xl
    format:
      dateStyle: long
      timeStyle: short
      hourCycle: h12
EOF
docker.yaml
This tells Homepage how to talk to the local Docker daemon for container status:
cat <<'EOF' > /opt/homepage/config/docker.yaml
local:
  socket: /var/run/docker.sock
EOF
bookmarks.yaml
Optional — add quick links to tools and references:
cat <<'EOF' > /opt/homepage/config/bookmarks.yaml
- Resources:
    - Proxmox Wiki:
        - icon: proxmox
          href: https://pve.proxmox.com/wiki
    - Docker Hub:
        - icon: docker
          href: https://hub.docker.com
    - Uptime Kuma Wiki:
        - icon: uptime-kuma
          href: https://github.com/louislam/uptime-kuma/wiki
EOF
3.3 — Start It Up
cd /opt/homepage
docker compose up -d
docker compose ps
You should see homepage running on port 3000.
Quick sanity check:
curl -s -o /dev/null -w "%{http_code}" http://localhost:3000
Should return 200.
3.4 — Add NPM Proxy Host
In NPM:
- Add Proxy Host
- Details tab:
| Field | Value |
|---|---|
| Domain Names | dash.lab.atilho.com |
| Scheme | http |
| Forward Hostname / IP | 192.168.4.4 |
| Forward Port | 3000 |
| Block Common Exploits | ✅ |
| Websockets Support | ✅ |
- SSL tab:
| Field | Value |
|---|---|
| SSL Certificate | Select the *.lab.atilho.com cert |
| Force SSL | ✅ |
| HTTP/2 Support | ✅ |
- Click Save
Test it: Open https://dash.lab.atilho.com. You should see your dashboard with all services listed, widgets pulling live data, and the search bar at the top.
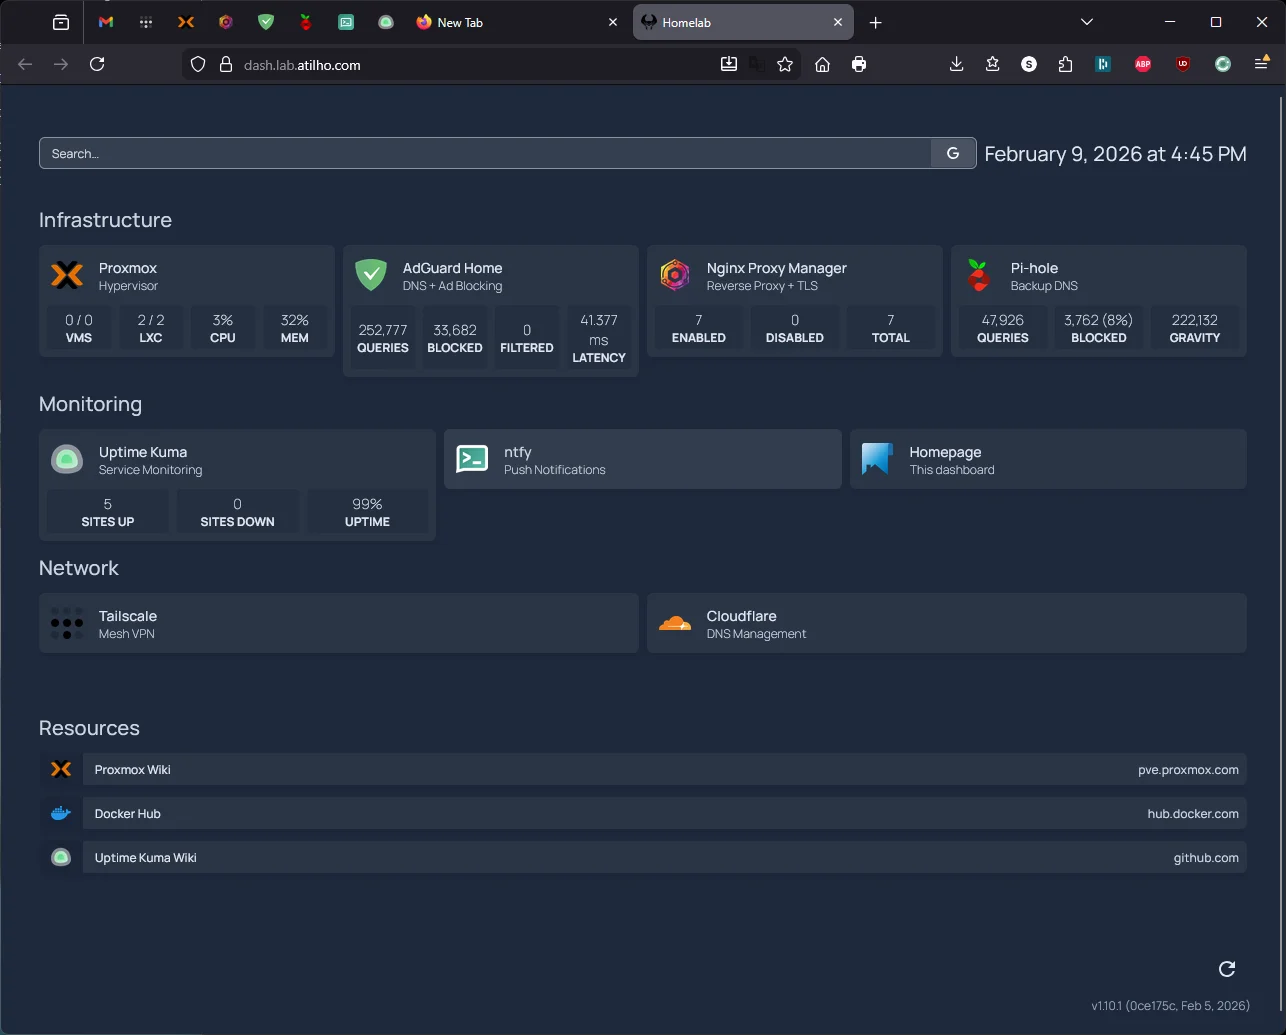
If any widgets show errors, double-check the credentials in services.yaml. The most common issue is a wrong password or an API key that needs regenerating.
3.5 — Tweaking the Dashboard
Homepage reloads config automatically — no restart needed. Edit the YAML files, save, and refresh the browser.
Some things worth customizing later:
- Icons: Homepage supports Dashboard Icons, Simple Icons, and direct image URLs. The
icon: proxmoxshorthand pulls from Dashboard Icons automatically. - Custom CSS: Drop a
custom.cssfile in the config directory if the built-in themes aren’t enough.
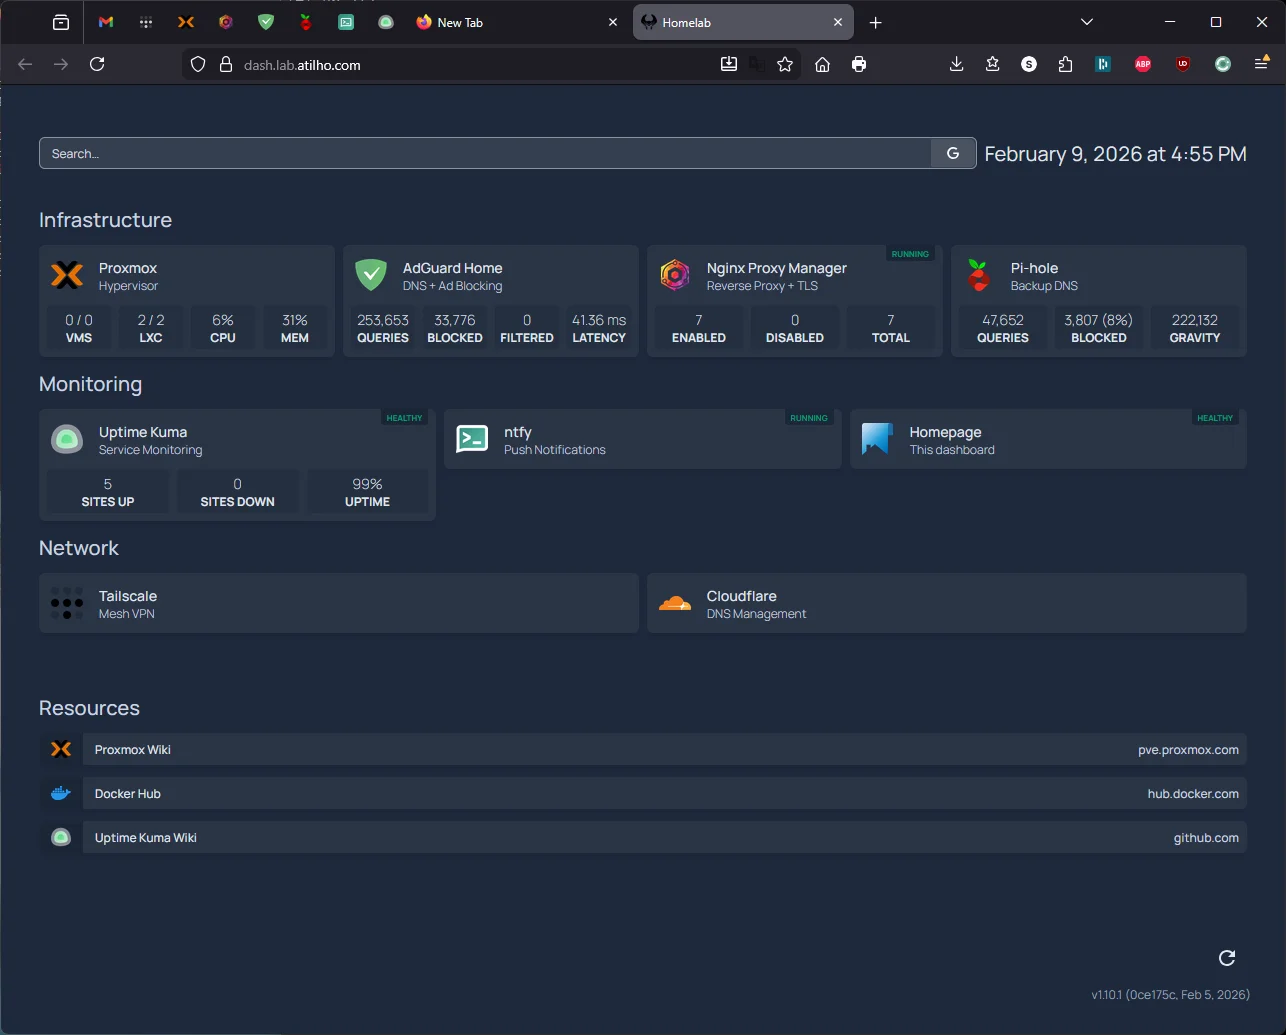
Optional: Docker Container Status Indicators
Homepage can show a small colored dot next to each service — green when the container is running, red when it’s stopped. This works for any service running as a Docker container on CT 101 since we already mounted the Docker socket.
To enable it, add server: local and container: <container_name> under each Docker-based service in /opt/homepage/config/services.yaml. The container value must match the container_name in that service’s docker-compose.yml.
Here’s what the additions look like for each CT 101 service:
    - Nginx Proxy Manager:
        icon: nginx-proxy-manager
        href: https://npm.lab.atilho.com
        description: Reverse Proxy + TLS
        server: local
        container: npm
        widget:
          ...

    - Uptime Kuma:
        icon: uptime-kuma
        href: https://status.lab.atilho.com
        description: Service Monitoring
        server: local
        container: uptime-kuma
        widget:
          ...

    - ntfy:
        icon: ntfy
        href: https://ntfy.lab.atilho.com
        description: Push Notifications
        server: local
        container: ntfy

    - Homepage:
        icon: homepage
        href: https://dash.lab.atilho.com
        description: This dashboard
        server: local
        container: homepage
The server: local value references the Docker connection we defined in docker.yaml earlier. Only services running as Docker containers on CT 101 can use this — Proxmox, AdGuard (CT 100), and Pi-hole (Raspberry Pi) are not Docker containers, so they don’t get status dots.
After saving, just refresh the browser — Homepage picks up config changes automatically, no restart needed.
Part 4: Verify the Full Stack
At this point, everything should be running. Let’s confirm.
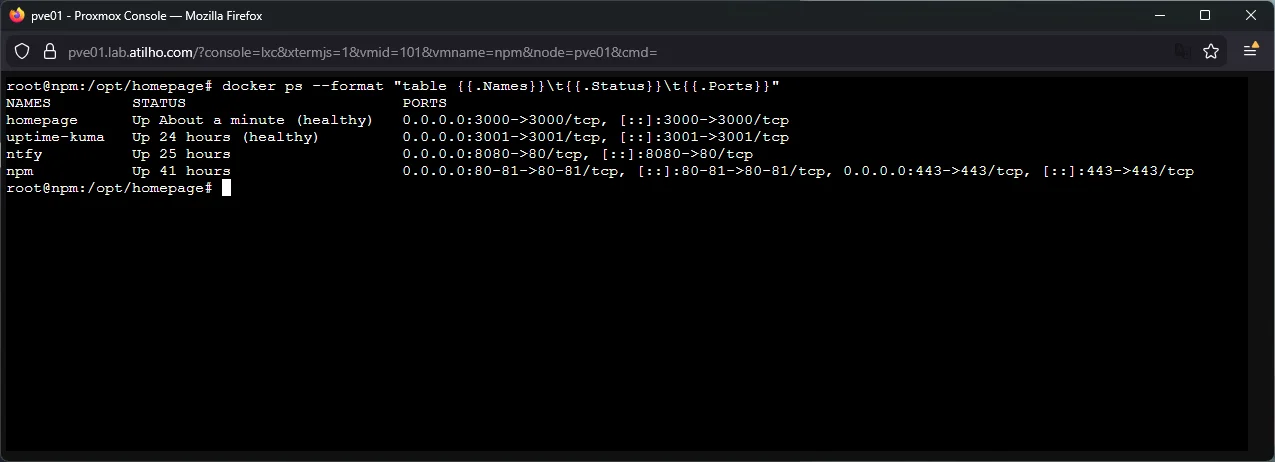
4.1 — Check All Docker Containers
docker ps --format "table \t\t"
You should see four containers:
| Name | Status | Ports |
|---|---|---|
npm |
Up (healthy) | 80-81, 443 |
uptime-kuma |
Up | 3001 |
ntfy |
Up | 8080->80 |
homepage |
Up (healthy) | 3000 |
4.2 — Check All Proxy Hosts
Open https://npm.lab.atilho.com → Hosts → Proxy Hosts. You should have seven proxy hosts, all showing Online:
| Hostname | Backend |
|---|---|
adguard.lab.atilho.com |
http://192.168.4.3:80 |
npm.lab.atilho.com |
http://192.168.4.4:81 |
pve01.lab.atilho.com |
https://192.168.4.2:8006 |
pihole.lab.atilho.com |
http://192.168.4.118:80 |
ntfy.lab.atilho.com |
http://192.168.4.4:8080 |
status.lab.atilho.com |
http://192.168.4.4:3001 |
dash.lab.atilho.com |
http://192.168.4.4:3000 |
4.3 — Check Uptime Kuma Monitors
Open https://status.lab.atilho.com. All five monitors should be green. If you’ve been working through this guide over the last 30–45 minutes, you should already have some uptime history building up.
4.4 — Check Remote Access
Switch your phone to cellular (disconnect from Wi-Fi), make sure Tailscale is active, and open:
https://dash.lab.atilho.com— Homepage dashboardhttps://status.lab.atilho.com— Uptime Kumahttps://ntfy.lab.atilho.com— ntfy web UI
All three should work over Tailscale with valid HTTPS — the Split DNS and subnet routing from Part 2 already cover any new *.lab.atilho.com subdomain.
Part 5: Container Housekeeping
5.1 — Check Disk Usage
The Wyse 5070’s SSD is limited. Let’s see where we stand:
df -h /
Also check Docker’s footprint:
docker system df
If things are getting tight, docker system prune will clean up unused images, build cache, and stopped containers. Be careful with -a — it removes all unused images, not just dangling ones.
5.2 — Take a Snapshot
Everything’s working. Snapshot CT 101 in Proxmox:
CT 101: post-monitoring-setup
This captures the state of all four Docker services, their config files, and volume data. If something breaks during future tinkering, you can roll back to this known-good state.
Reminder: Snapshots eat disk space over time as data changes. Delete old snapshots once you’ve confirmed things are stable. Run
lvson the Proxmox host to check actual thin pool usage.
Troubleshooting
ntfy iOS notifications not arriving?
The native iOS app has known issues with self-hosted servers — notifications silently fail or arrive without content. This is a documented upstream bug involving Firebase/APNs relay behavior, not a server config problem.
First try: Save https://ntfy.lab.atilho.com as a web app (PWA) on your home screen via Safari and enable browser notifications when prompted. The PWA uses standard Web Push instead of APNs. See Part 1.6 for the full setup.
If the PWA is also unreliable (iOS suspends background web app activity when the device is locked for long periods), set up Telegram as your Uptime Kuma notification channel instead. Telegram’s iOS push delivery is rock-solid and takes 5 minutes to configure. See Part 2.6.
Uptime Kuma shows a monitor as down but the service is actually running?
Check the URL and port in the monitor config. Common mistakes:
- Using
https://for a service that only speaks HTTP internally - Wrong port number
- Not toggling “Ignore TLS/SSL errors” for services with self-signed certs (Proxmox)
From inside CT 101, test connectivity directly:
curl -k https://192.168.4.2:8006  # Proxmox
curl http://192.168.4.3:80         # AdGuard
curl http://localhost:8080/v1/health  # ntfy
Homepage widgets showing “Error” or “N/A”?
The credentials in services.yaml are wrong, or the service’s API isn’t accessible from CT 101. Test from inside the container:
docker exec homepage wget -qO- http://192.168.4.3 | head
For the Proxmox widget specifically, since Proxmox uses a self-signed certificate, the HOMEPAGE_ALLOW_INSECURE: "true" environment variable we set in docker-compose handles this. If you’re still seeing SSL errors, verify the env var is present and the container has been recreated (not just restarted):
docker compose exec homepage env | grep ALLOW_INSECURE
Homepage Pi-hole widget shows “Failed to authenticate with Pi-hole”?
Pi-hole v6 changed its API from static tokens to session-based authentication over HTTPS. There are several things that must all be correct:
- URL must be HTTPS: Pi-hole v6 serves its API over HTTPS by default. Use
https://192.168.4.118— nothttp://. TheHOMEPAGE_ALLOW_INSECURE: "true"env var in docker-compose tells Homepage to accept Pi-hole’s self-signed certificate. version: 6is required: Without this, Homepage tries the v5 API format (/admin/api.php), which doesn’t exist in v6. You’ll get a 400 Bad Request.- Use
key, notpassword: The v6 widget expectskey:in services.yaml —password:is for v5. - Env var names must match exactly: If docker-compose defines
HOMEPAGE_VAR_PIHOLE_KEYbut services.yaml references ``, the value will be empty and authentication fails silently. Double-check both files. - Quote passwords with special characters: Pi-hole app passwords contain
/,+, and=. Wrap the value in double quotes in docker-compose.yml:HOMEPAGE_VAR_PIHOLE_KEY: "p/ts3o+xUv=". Without quotes, YAML misparses=and the variable arrives empty inside the container. You can verify what Homepage actually sees with:docker compose exec homepage env | grep HOMEPAGE_VAR_PIHOLE
Homepage shows a blank page through the proxy?
HOMEPAGE_ALLOWED_HOSTS doesn’t include dash.lab.atilho.com. Check the docker-compose environment variable. After fixing, restart:
cd /opt/homepage
docker compose down && docker compose up -d
Port conflict when starting a container?
If you see “port is already allocated”, another service grabbed that port. Check what’s using it:
ss -tlnp | grep ':3001'
Docker images pulling slowly or failing?
The Wyse has limited bandwidth through its single NIC and Docker Hub can rate-limit pulls. If a pull times out, just try again:
docker compose pull && docker compose up -d
Everything was working but broke after a reboot?
Check that all containers started. Docker’s restart: unless-stopped policy should handle this, but verify:
docker ps -a
If a container shows Exited, check its logs:
docker logs ntfy
docker logs uptime-kuma
docker logs homepage
Maintenance Cheatsheet
| Task | Command / Location |
|---|---|
| All dashboards | https://dash.lab.atilho.com |
| Uptime Kuma | https://status.lab.atilho.com |
| Send test notification | curl -d "test" https://ntfy.lab.atilho.com/homelab-alerts |
| Check all containers | docker ps (inside CT 101) |
| Restart ntfy | cd /opt/ntfy && docker compose restart |
| Restart Uptime Kuma | cd /opt/uptime-kuma && docker compose restart |
| Restart Homepage | cd /opt/homepage && docker compose restart |
| View container logs | docker logs <container-name> --tail 50 |
| Update all images | cd /opt/<service> && docker compose pull && docker compose up -d |
| Clean unused images | docker system prune |
| Edit Homepage config | nano /opt/homepage/config/services.yaml (auto-reloads) |
| Edit ntfy config | nano /opt/ntfy/config/server.yml (requires restart) |
| Disk usage check | df -h / && docker system df |
| Snapshot CT 101 | Proxmox GUI → CT 101 → Snapshots → Take Snapshot |
What’s Running Now
| Layer | Service | Internal Access | HTTPS Access |
|---|---|---|---|
| Hypervisor | Proxmox VE | 192.168.4.2:8006 |
https://pve01.lab.atilho.com |
| CT 100 | AdGuard + Unbound | 192.168.4.3:80 |
https://adguard.lab.atilho.com |
| CT 101 | Nginx Proxy Manager | 192.168.4.4:81 |
https://npm.lab.atilho.com |
| CT 101 | Uptime Kuma | 192.168.4.4:3001 |
https://status.lab.atilho.com |
| CT 101 | ntfy | 192.168.4.4:8080 |
https://ntfy.lab.atilho.com |
| CT 101 | Homepage | 192.168.4.4:3000 |
https://dash.lab.atilho.com |
| Raspberry Pi | Pi-hole + Unbound | 192.168.4.118:80 |
https://pihole.lab.atilho.com |
| Tailscale | All services on tailnet | 100.x.x.x |
Same HTTPS URLs remotely |
The Wyse is still barely breaking a sweat. All four Docker containers on CT 101 — NPM, Uptime Kuma, ntfy, and Homepage — use maybe 500–600 MB of RAM combined. The J5005 CPU sits at near-idle. There’s still plenty of headroom for more services.
The difference now is that the homelab actually tells me when it needs attention. Something goes down, my phone buzzes within 60 seconds. I open https://dash.lab.atilho.com from anywhere and see the full picture. That’s the whole point — infrastructure that watches itself so I don’t have to.
What’s next: The Wyse still has room for a password manager (Vaultwarden), and once I add a second node, Grafana + Prometheus for real metrics visualization. But that’s a writeup for another day.